Almost two years ago I wrote a post explaining how we redistribute wealth in America. I wrote it in response to claims by the GOP and numerous other conservative groups that the poor and the unemployed don't need help. Their rationale? America is not a nation that redistributes wealth. People should work and pull themselves up by their own bootstraps.
This was an easy topic to write about because, well, the United States has been redistributing wealth for a long time. In fact, we've been redistributing wealth for such a long time that we've been able to track the process over time. We can actually see who pays and who takes from Uncle Sam. An updated study helps make it very clear that those yelling the loudest about people mooching off the system are living in states that receive the most government funds.
Let me restate that. There's another study out that shows, once again, that the most conservative Red States are still mooching off those of us living in the Blue States.

According to the survey, for example, for every dollar that California sends to the federal government we only get about 94 cents back. This is an improvement from the end of 2009, when the we learned that over a 20 year period the federal government kept over $330 billion in federal taxes that Californians sent in (which was used to prop up those living in the Red States).
This story is so glaring that even the conservative Wall Street Journal couldn't ignore the federal redistribution of wealth to the Red States story.
Below are the numbers from the new survey, which you can read about here ...
- Mark
UPDATE (10-22-14): Here's another list of the 10 states that are most dependent on the federal government for financial transfers.
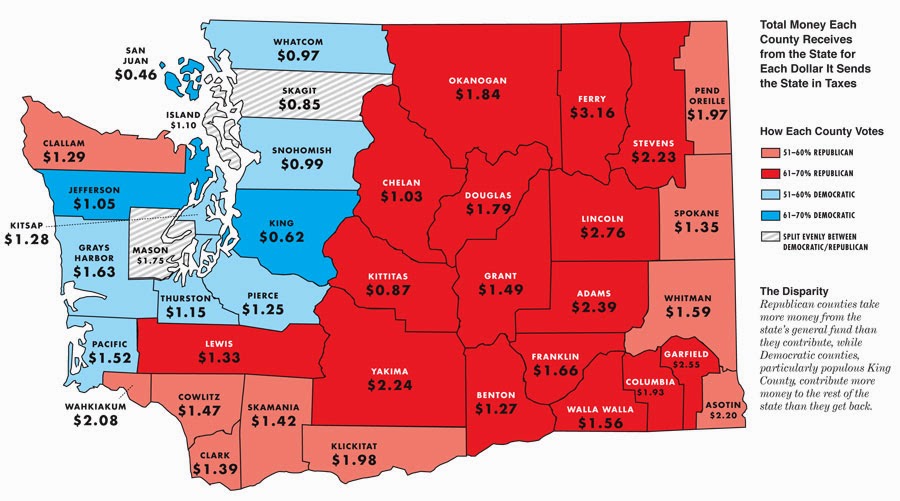
I want to make it clear that the Red State-Blue State tax redistribution process also happens within states, at the county level. The revenue redistribution maps of Washington and California below make this abundantly clear ...

This was an easy topic to write about because, well, the United States has been redistributing wealth for a long time. In fact, we've been redistributing wealth for such a long time that we've been able to track the process over time. We can actually see who pays and who takes from Uncle Sam. An updated study helps make it very clear that those yelling the loudest about people mooching off the system are living in states that receive the most government funds.
Let me restate that. There's another study out that shows, once again, that the most conservative Red States are still mooching off those of us living in the Blue States.

According to the survey, for example, for every dollar that California sends to the federal government we only get about 94 cents back. This is an improvement from the end of 2009, when the we learned that over a 20 year period the federal government kept over $330 billion in federal taxes that Californians sent in (which was used to prop up those living in the Red States).
This story is so glaring that even the conservative Wall Street Journal couldn't ignore the federal redistribution of wealth to the Red States story.
Below are the numbers from the new survey, which you can read about here ...
| Rank | State Name | Return on Taxpayer Investment(Category Rank) | Funding as % of Revenue(Category Rank) | Federal Employees Per Capita(Category Rank) |
|---|---|---|---|---|
| 1 | Delaware | $0.50 (1) | 25.37% (7) | 6.17 (10) |
| 2 | Illinois | $0.56 (3) | 26.23% (8) | 6.45 (11) |
| 3 | Minnesota | $0.56 (2) | 28.47% (12) | 5.91 (8) |
| 4 | New Jersey | $0.88 (10) | 27.53% (11) | 5.75 (6) |
| 5 | Connecticut | $1.28 (25) | 23.68% (4) | 4.91 (1) |
| 6 | Kansas | $0.71 (6) | 27.21% (9) | 9.19 (31) |
| 7 | California | $0.94 (14) | 28.82% (13) | 6.65 (13) |
| 8 | Nevada | $1.15 (23) | 27.48% (10) | 6.60 (12) |
| 9 | Massachusetts | $0.94 (13) | 29.56% (17) | 7.09 (19) |
| 10 | Colorado | $0.84 (8) | 29.24% (15) | 10.67 (35) |
| 11 | New Hampshire | $1.07 (18) | 32.06% (21) | 5.61 (4) |
| 12 | Michigan | $1.08 (19) | 34.12% (25) | 5.33 (3) |
| 13 | Ohio | $0.66 (5) | 35.87% (36) | 6.78 (15) |
| T-14 | Utah | $0.86 (9) | 31.65% (20) | 12.58 (40) |
| T-14 | Nebraska | $0.57 (4) | 34.92% (31) | 9.06 (28) |
| 16 | Washington | $1.05 (17) | 29.38% (16) | 10.73 (36) |
| T-17 | District of Columbia | $1.15 (22) | 23.90% (5) | 336.63 (51) |
| T-17 | New York | $0.79 (7) | 37.74% (41) | 6.06 (9) |
| T-17 | Iowa | $1.12 (21) | 34.85% (29) | 5.75 (5) |
| 20 | Wisconsin | $1.68 (38) | 28.93% (14) | 5.08 (2) |
| 21 | Alaska | $1.42 (31) | 20.01% (1) | 22.68 (48) |
| 22 | Arkansas | $1.1 (20) | 34.52% (28) | 7.01 (17) |
| 23 | Pennsylvania | $1.31 (27) | 30.91% (18) | 7.87 (24) |
| 24 | North Carolina | $1.34 (28) | 33.91% (24) | 7.22 (20) |
| 25 | Indiana | $2.01 (41) | 33.20% (23) | 5.76 (7) |
| 26 | Virginia | $1.75 (39) | 24.81% (6) | 21.52 (47) |
| 27 | Oklahoma | $0.9 (11) | 36.21% (38) | 12.78 (41) |
| 28 | Oregon | $1.28 (26) | 36.16% (37) | 7.26 (21) |
| 29 | North Dakota | $5.31 (50) | 21.04% (2) | 13.70 (44 |
| 29 | Hawaii | $3.19 (46) | 23.60% (3) | 25.32 (50) |
| 31 | Idaho | $1.4 (29) | 35.16% (33) | 7.96 (25) |
| 32 | Texas | $1.43 (32) | 35.13% (32) | 7.77 (22) |
| T-33 | Rhode Island | $1.55 (34) | 34.48% (26) | 9.80 (32) |
| T-33 | Georgia | $1.05 (15) | 38.86% (44) | 10.44 (34) |
| 35 | Vermont | $1.41 (30) | 34.86% (30) | 10.38 (33) |
| 36 | Missouri | $1.05 (16) | 40.83% (47) | 9.19 (30) |
| 37 | Maryland | $1.61 (35) | 31.29% (19) | 25.06 (49) |
| T-38 | Wyoming | $0.91 (12) | 39.73% (46) | 13.17 (42) |
| T-38 | Florida | $4.57 (49) | 32.65% (22) | 6.96 (16) |
| 40 | South Carolina | $7.87 (51) | 34.49% (27) | 7.03 (18) |
| 41 | Kentucky | $2.39 (43) | 35.83% (35) | 9.10 (29) |
| 42 | Arizona | $1.62 (36) | 39.35% (45) | 8.71 (27) |
| T-43 | South Dakota | $1.16 (24) | 41.53% (49) | 13.95 (45) |
| T-43 | West Virginia | $2.22 (42) | 35.46% (34) | 12.56 (39) |
| 45 | Tennessee | $1.64 (37) | 41.27% (48) | 7.82 (23) |
| T-46 | Montana | $1.55 (33) | 38.54% (43) | 13.53 (43) |
| T-46 | Maine | $1.79 (40) | 36.63% (39) | 10.92 (37) |
| 48 | Louisiana | $3.35 (48) | 44.26% (50) | 6.76 (14) |
| 49 | Alabama | $3.28 (47) | 37.02% (40) | 11.66 (38) |
| T-50 | New Mexico | $2.83 (44) | 37.90% (42) | 15.22 (46) |
| T-50 | Mississippi | $3.07 (45) | 45.84% (51) | 8.67 (26) |
- Mark
UPDATE (10-22-14): Here's another list of the 10 states that are most dependent on the federal government for financial transfers.
I want to make it clear that the Red State-Blue State tax redistribution process also happens within states, at the county level. The revenue redistribution maps of Washington and California below make this abundantly clear ...


No comments:
Post a Comment